Lifetime Wealth Portfolio update June 2019
The last update for Lifetime Wealth Portfolio (LWP) took place on 11 April 2018. Back then we rebalanced the portfolio by reducing the best performing holding over the previous year which was emerging markets. We then used the proceeds to add to poorly performing holdings which were UK property and gilts.
Emerging markets performed poorly last year, so reducing them worked out well. Gilts also performed well, so that was also beneficial. The trade that didn’t work was UK property which came at the bottom of the league tables for two years in a row. We could add more to that this year, but it’s not essential as the trade is relatively small.
To remind you of the investment case for a passive asset allocation strategy, as opposed to an active strategy:
1. Diversification spreads risk so that the worst outcomes are avoided, as you are not overly dependent on any one fund or asset class.
2. This simple approach enables investors to carry on with their lives without devoting too much time into their finances.
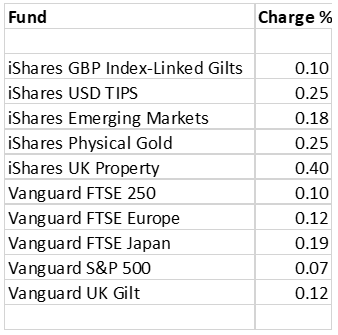
3. Low-cost investment strategies avoid high charges. These come in two forms, the cost of the investments from fund charges, dealing costs and taxes, and advice fees. Together these can be high. LWP has ten funds, all of which charge less than active managers. The cheapest is US equities which charges 0.07% per annum. The most expensive is UK Property at 0.4% per annum. Since some funds are cheap, and others are a little more, the overall cost of the portfolio is 0.155%.
I would be highly surprised if you can find a more cost-effective diversified portfolio anywhere. I’m not entirely surprised by that, since this portfolio was designed by the editorial team at Money Week – renowned for counting the pennies.
4. Periodic rebalancing transactions add to performance as it is a value strategy. That means if an investment does well, you should trim it back at a high price. Similarly, if something does badly, you’d be adding more at a lower price. By repeating that process over the years, you’ll be buying low and selling high, and therefore adding value to your portfolio.
2019 update
I wrote the update on LWP last year, and at this rate, will probably write it next year too. While I have huge respect for passive investment strategies, I should remind you that I am an active manager with 21 years’ experience in active investing. I am the editor of The Fleet Street Letter and a professional fund manager. What irks me about passive investment strategies is how they make it all look so easy. Amazingly, there’s no catch and keeping it simple works very well.
Passive asset allocation is a highly scalable investment strategy that can assist people to save for the future in a cost- and time-efficient manner. The diversification helps to preserve your capital over the long term, while the annual rebalancing boosts returns. Best of all, you don’t have to do very much at all. You can get on with your life knowing that your investment strategy is quietly ticking away in the background. Just read this once a year and carry out the transactions.
The caveat to passive investing
It all works swimmingly provided the asset classes never go to zero. That is, you are buying more of the worst performing assets every year, while selling the best. If all of the assets have seemingly random good and bad years yet end up in roughly the same place in the long run, then rebalancing makes perfect sense. But if an asset class were to slump, and keep on slumping, you’d be buying more every year, and pouring money down the drain in the process. To the best of my knowledge, assets do periodically slump, but generally recover at some point thereafter.
But it’s a point worth understanding.
For example, government bonds were a disastrous investment in the 1960s and 1970s. That was due to rising inflation which saw yields rise from low levels of around 4% to high levels of around 16% by 1981. A passive rebalancing strategy, would be buying more bonds each year, throwing good money after bad. An “equivalent” ten-year bond bought in 1962 had lost 65% of its face value by 1981.
But then things improved. In 1981, bonds started to rise, while they were also paying a whopping 16% per annum dividend. Bonds were fabulous from 1981 onwards, but considerable damage had been done to bond investors.
It all works out in the end, but some assets can be out of favour for two or three decades in a row. Gold sank from 1980 to 1999. Japanese equities have been sinking since 1990, and probably still are. Having different assets in the portfolio is something to be celebrated, as they could do well when others slump.
That is what we mean by diversification – different behaviour, and at different times. For if they all did well at the same time, the portfolio wouldn’t be diversified at all.
I highlight this point be because we live in interesting times. Bond yields are not 4% like in 1962, but 2% or less depending which country you are measuring. If or when inflation returns, the portfolio will behave very differently. Gold, property and inflation-linked bonds will be the new stars. Japan and emerging markets will likely perk up while US equities will take their turn in the doghouse.
But the Money Week team who designed LWP knew this. With this strategy, you can’t lose everything because this portfolio caps bond exposure to 25%, and 15% or which is inflation linked. Provided the other 75% is behaving more normally, then a collapse in bonds over two decades will be more of a headache than a disaster.
Background of Lifetime Wealth
LWP was founded in April 2013 with the intention of investing the then ISA allowance of £11,520 in a diversified passive portfolio of low-cost exchange-traded funds (ETFs). There is no such thing as a truly passive portfolio because you have to make certain decisions.
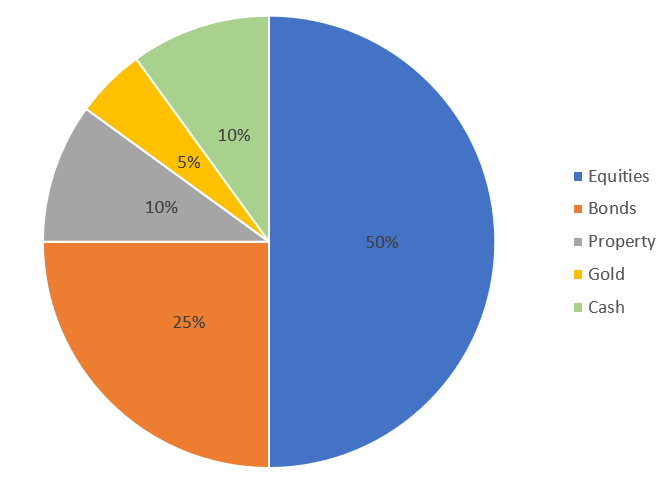
For LWP, there was a target asset allocation which was designed to give you a high level of diversification. That comprises equities, bonds, property, gold and cash. It was decided to hold 50% in equities, which deliver long-term growth, and 50% in non-equity, which offers stability and inflation protection. The LWP target allocation is shown in the pie chart. This will not change.
The Lifetime Wealth Target Allocation
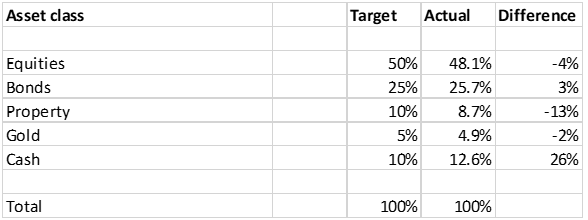
But over time, asset prices change, and this will shift the actual asset allocation within LWP. When an asset performs well, its allocation rises, and so you have to reduce exposure in order to keep the portfolio in line – and vice versa.
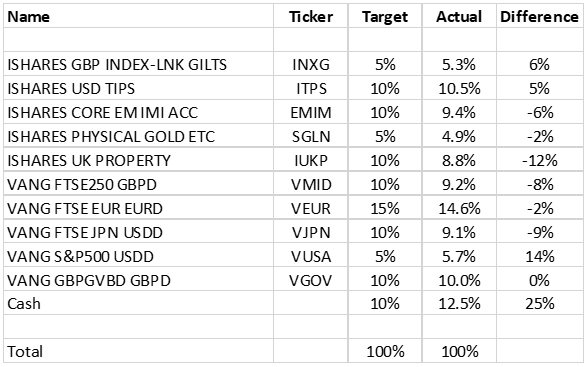
Over the past year, cash has risen the most in allocation terms (not the same as performing best) and its allocation has risen to 12.6% of LWP; up from 11.2%. Recall that dividend income has made an important contribution to that. Bond exposure is also higher than a year ago. In contrast, property, gold and equities have seen their weights fall.
Current portfolio versus target allocation
Keeping a lid on costs
The rebalancing rules were created so that only 20% deviations between the actual and target allocations will be amended. This is to keep trading costs to a minimum. For example, to rebalance gold to 5% would require a 0.1% transaction. Given that is around £16 worth of gold for this portfolio, it wouldn’t be cost effective.
That said, cash is 2.6% higher than it should be, thanks to those dividends. That is over £400, and around £300 of income is expected next year, so that ought to be put to work. The only significant underweight is UK property, which is 13% below the intended allocation.
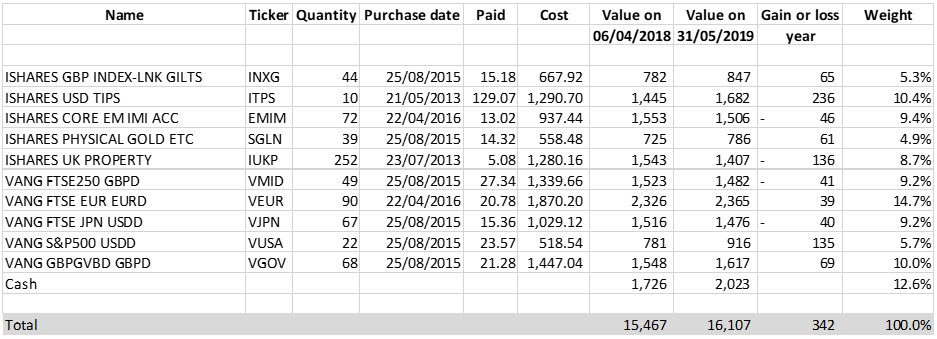
Lifetime Wealth Portfolio as at 31 May 2019
Performance
The portfolio is now worth £16,107, which compares to £15,436 on 6 April 2018. That increase of 4.3% is very close to the FTSE 100 itself if you include dividends.
Over the past year, inflation-linked bonds in both the UK (INXG) and the US (ITPS) have made strong contributions, along with US equities (VUSA). UK property (IUKP), FTSE 250 (VMID), Japan (VJPN) and emerging markets (EMIM) have all held the portfolio back. Recall that UK property pays a good income, but even so, still came in last place.
An American year
It’s been America’s year. Europe has been stunted by zero rates, near zero growth and troubled politics. China has come to the end of a four-decade growth spurt and the global economy is slowing down. The US has become the preferred choice for global capital and is driving the dollar higher in the process.
This is important in investments because a great investment in a lousy currency will only deliver a mediocre result. It is unsurprising that both US equities and inflation-linked bonds have both done well with the dollar behind them.
Falling pound
Foreign assets such as the equities and bonds in the US, Japan, Europe and emerging markets have all done better than expected when measured in sterling terms, because the pound has been weak. That has also been true for gold. The pound is widely deemed to be cheaply valued, but the uncertain politics has kept investors at bay. Until there is a post-Brexit settlement, we should expect the unexpected.
In the next chart, you can see all of the holdings performance.
Lifetime Wealth Holdings – performance over the past year
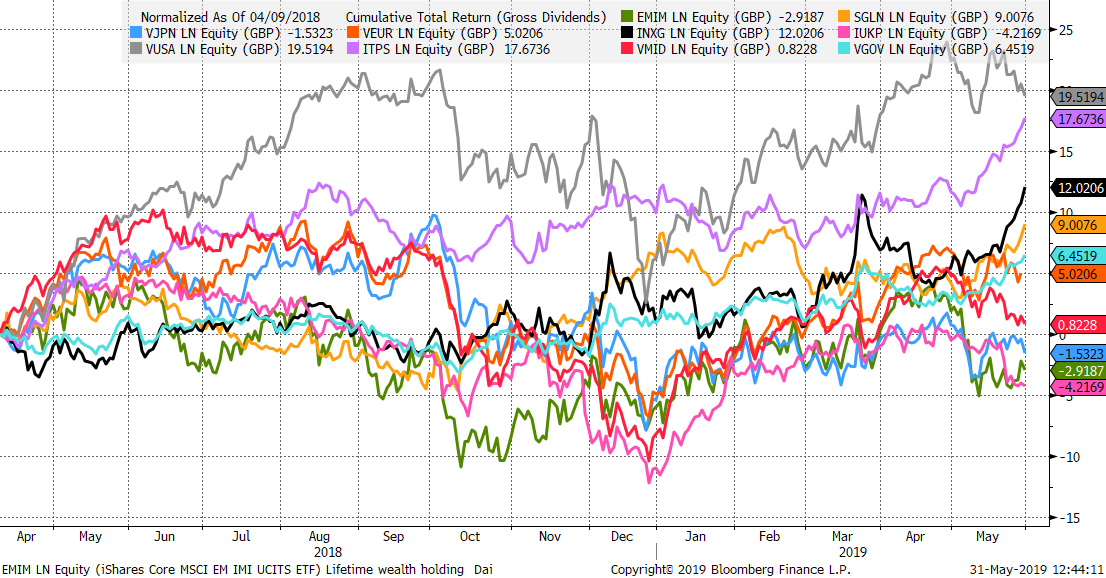
Source Bloomberg: iShares GBP Index-Linked Gilts (INXG, black), iShares USD TIPS (ITPS, purple), iShares Emerging Markets (EMIM, green), iShares Physical Gold (SGLN, gold), iShares UK Property (IUKP, pink), Vanguard FTSE 250 (VMID, red), Vanguard FTSE Europe (VEUR, blood orange), Vanguard FTSE Japan (VJPN, blue), Vanguard S&P 500 (VUSA, grey), Vanguard UK Gilt (VGOV, cyan) – since 6 April 2018 to 31 May 2019 total return in GBP
The chart shows capital return plus dividends received, known as total return. The assets have been normalised (start at the same point) so you can see how much was made or lost over the past year in percentage terms. US equities, US TIPS and UK inflation-linked gilts have performed best. UK property, emerging markets and Japanese equities have performed worst.
Dividends received
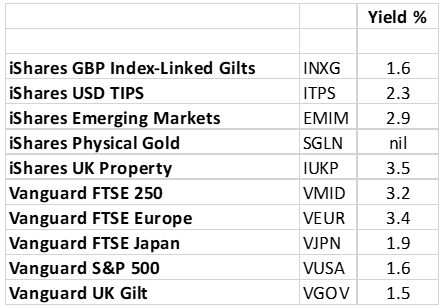
Since the last update, the portfolio has generated £313 of dividend income. Of the ten funds, three pay no income. One is gold, which has no income. The other two, emerging market equities and US TIPS do pay income or approximately 2.9% and 2.3% respectively. But that has been accumulated via a higher fund price rather than a distribution (dividend).
The other holdings paid dividends over the past year as follows:
| Quantity | Ex-Div date | Dividend | FX | £ Received | |
| iShares GBP Index-Linked Gilts INXG | |||||
| 44 | 05/16/19 | 0.139800 | GBP | 1 | 6.15 |
| 44 | 11/15/18 | 0.161600 | GBP | 1 | 7.11 |
| 44 | 05/17/18 | 0.181600 | GBP | 1 | 7.99 |
| iShares UK Property IUKP | |||||
| 252 | 05/16/19 | 0.057 | GBP | 1 | 14.36 |
| 252 | 02/14/19 | 0.034 | GBP | 1 | 8.57 |
| 252 | 11/15/18 | 0.05 | GBP | 1 | 12.60 |
| 252 | 08/16/18 | 0.0546 | GBP | 1 | 13.76 |
| 252 | 05/17/18 | 0.0611 | GBP | 1 | 15.40 |
| Vanguard FTSE 250 VMID | |||||
| 49 | 03/28/19 | 0.148825 | GBP | 1 | 7.29 |
| 49 | 12/27/18 | 0.208348 | GBP | 1 | 10.21 |
| 49 | 09/27/18 | 0.23775 | GBP | 1 | 11.65 |
| 49 | 06/21/18 | 0.361788 | GBP | 1 | 17.73 |
| 49 | 03/22/18 | 0.187524 | GBP | 1 | 9.19 |
| 49 | 12/21/17 | 0.236296 | GBP | 1 | 11.58 |
| 49 | 09/21/17 | 0.194232 | GBP | 1 | 9.52 |
| Vanguard FTSE Europe VEUR | |||||
| 90 | 03/28/19 | 0.183117 | EUR | 1.16 | 14.18 |
| 90 | 12/27/18 | 0.114449 | EUR | 1.11 | 9.31 |
| 90 | 09/27/18 | 0.157723 | EUR | 1.12 | 12.63 |
| 90 | 06/21/18 | 0.551316 | EUR | 1.14 | 43.49 |
| Vanguard FTSE Japan VJPN | |||||
| 67 | 03/28/19 | 0.03442 | USD | 1.30 | 1.77 |
| 67 | 12/27/18 | 0.217118 | USD | 1.26 | 11.50 |
| 67 | 09/27/18 | 0.026001 | USD | 1.31 | 1.33 |
| 67 | 06/21/18 | 0.255538 | USD | 1.32 | 12.93 |
| Vanguard S&P 500 VUSA | |||||
| 22 | 03/28/19 | 0.23471 | USD | 1.30 | 3.96 |
| 22 | 12/27/18 | 0.214551 | USD | 1.26 | 3.73 |
| 22 | 09/27/18 | 0.222616 | USD | 1.31 | 3.74 |
| 22 | 06/21/18 | 0.202775 | USD | 1.32 | 3.37 |
| Vanguard UK Gilt VGOV | |||||
| 68 | 05/23/19 | 0.033932 | GBP | 1 | 2.31 |
| 68 | 04/18/19 | 0.020429 | GBP | 1 | 1.39 |
| 68 | 03/28/19 | 0.034247 | GBP | 1 | 2.33 |
| 68 | 02/21/19 | 0.034499 | GBP | 1 | 2.35 |
| 68 | 01/17/19 | 0.022532 | GBP | 1 | 1.53 |
| 68 | 12/27/18 | 0.025399 | GBP | 1 | 1.73 |
| 68 | 11/29/18 | 0.034075 | GBP | 1 | 2.32 |
| 68 | 10/25/18 | 0.027492 | GBP | 1 | 1.87 |
| 68 | 09/27/18 | 0.034257 | GBP | 1 | 2.33 |
| 68 | 08/23/18 | 0.026868 | GBP | 1 | 1.83 |
| 68 | 07/26/18 | 0.034114 | GBP | 1 | 2.32 |
| 68 | 06/21/18 | 0.026186 | GBP | 1 | 1.78 |
| 68 | 05/24/18 | 0.02751 | GBP | 1 | 1.87 |
| 68 | 04/26/18 | 0.034016 | GBP | 1 | 2.31 |
| Total | 313.31 | ||||
If that was too much information, the historic yields for the past 12 months is shown for each fund in the table below. None of these are very high which reflects the state of the market. Asset prices have run hard for ten years, and as a result, yields are comparably low.
 Source Bloomberg
Portfolio changes
The asset allocation shows cash to be on the high side, but there is no trade worth doing on the other side. If you reduced US equities by 0.7%, you’d have even more cash and the trade would be for £112. With dealing charges often over £10, this doesn’t seem to be worthwhile.
I would like to invest the excess 2.5% in cash into UK property, but that only needs 1.2% which is under £200, so is borderline. This time next year, the income will have accrued by another £300 and boost cash by another 1.9% (plus or minus asset price moves). On that basis, I believe you should sit tight this year and revisit rebalancing next year.
No action required
Summary
The portfolio was initiated in April 2013 with one ISA, which was £11,520. The value today is £16,107 which represents a 40% gain since inception. The fees paid have been low and the maintenance required even lower.
The past year has seen LWP make some modest gains. Those would have been stronger had there been more exposure to the US. LWP has roughly 4% in UK large cap equities (24% of a 15% holding in VEUR) and 10% in mid-caps. There is 10% in Japan, and just 5% in the US (plus TIPS).
By putting twice as much into UK mid-caps as large caps, and the same again into Japanese equities versus US equities, the Money Week team definitely held a view there. But they had to as any multi-asset portfolio that aims to be passive, has to revolve around something.
In a year where the winners were American, having a low exposure held LWP back. But things change and US equities are generally deemed to be richly priced. Let’s hope this will swing around next year.

Charlie Morris
Editor, Southbank Investment Research