Daily Profit Alert – The Retirement Pot Accelerator
The Microtrend Profit Method is an event produced by Southbank Investment Research Ltd. Your capital is at risk when you invest, never risk more than you can afford to lose. Seek independent advice if you’re unsure of the suitability of any investment. Forecasts and simulated past performance are not reliable indicators of future results.
Try out our new, steady wealth-building system:
“THE RETIREMENT POT ACCELERATOR”
No leverage. No shorting. Just buying and selling big stocks.
It could have made you 89% in this year’s falling market – here’s how to get it working for you:
Nick O’Connor:Hello and welcome to this exclusive walk-through of our brand-new wealth accumulation strategy.
I’m your host, Nick O’Connor.
In this broadcast you’re going to see how it’s possible to take the small moves stocks make all the time – between 5 and 8 percent…
And turn them into a BIG potential windfall sitting in your trading account.
Forecasts are not reliable indicators of future results.
But CRUCIALLY – you’ll see how, using this method, you’ll never be risking more than half a percent of your overall pot.
The potential here, is really breath-taking, over the long run.
Our back-testing shows that using this method, over the last decade, would have changed the financial lives of most people…
Turning a starting pot of just ten thousand pounds into almost a quarter of a million quid.
Figures refer to simulated past performance and past performance is not a reliable indicator of future performance.
We’ll dive deeper into the numbers as we go along today.
But CRUCIALLY, I want you to know that this new wealth building method doesn’t use leverage, shorting, options or CFDs.
It’s nothing more complicated than buying big stocks using an online broker.
But it’s made possible by a system we’ve been developing for the best part of a year.
After months of rigorous testing and data-mining, from computer scientists here in the UK and in Hong Kong…
You’re about to see how it works…
And get the chance to try it out for yourself.
So – why have we spent so much time and money on this new project?
Well, we know that many of our readers are concerned about their retirement plans. retirement.
A big – justified – concern right now is growing your nest egg in the face of extreme challenges.
With inflation still riding high – predicted to double from here by some…
Interest rates rising… Stocks incredibly volatile… Bonds having a torrid time…
And the pound recently sinking to record lows…
This emerging financial crisis has come at the wrong time for a lot of people. Perhaps that’s how you feel too.
You don’t want to downgrade your plans for your golden years, I am sure.
But you still want to grow your nest egg despite the tough financial landscape.
We developed this system for investors and wealth builders like you.
Someone who wants the chance to increase their pot steadily – with confidence.
Not by swinging for big, long-shot returns.
And certainly without taking on the big risks normally associated with big stock market returns.
Instead, you’re going to see how to turn the unremarkable SMALL moves – the ‘micro-moves’ – that big stocks make ALL THE TIME…
…into the kind of profits that could make a huge difference to your bank balance and retirement plans.
Forecasts are not reliable indicators of future results.
As I said at the start, our historical back-testing suggests we’re really onto something with this system.
Since 2011, all through the ups and downs of the last decade…
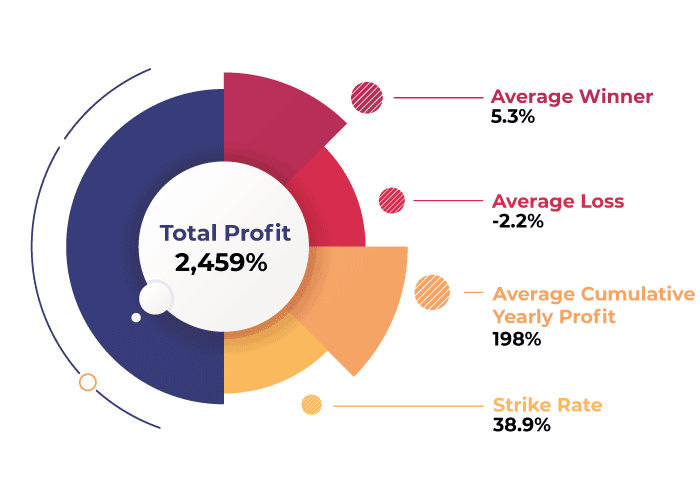
This method would have steadily stacked up a 2,459% cumulative profit.
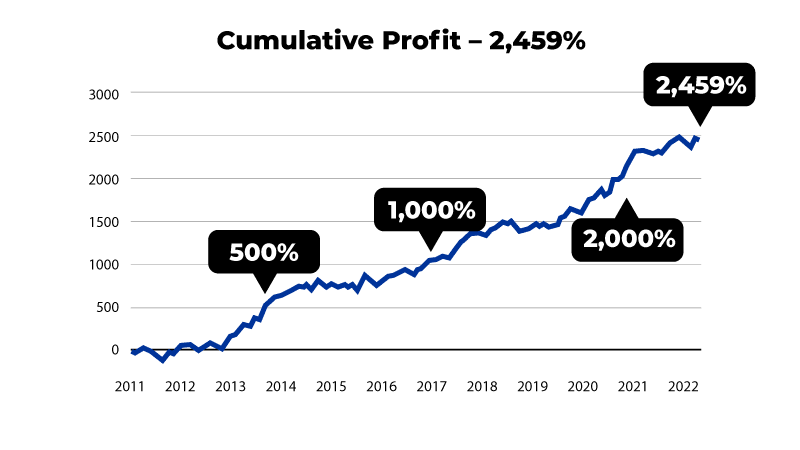
Past performance is not a reliable indicator of future results.
Now that figure is past performance. It’s also backtesting. That means there is no guarantee that it will perform in the same way going forward. We’ll take a look at what that backtest involved later in today’s broadcast.
But what should be clear even at now – at, what, two minutes in? – is that if you stick with us in this broadcast…
You’ll discover a new trading approach that could have a meaningful impact on your wealth.
One that DOESN’T rely on long-shot bets paying off.
Just imagine you could turn a £10k trading account into almost £250,000 over the next decade (before costs and taxes)…
Figures refer to simulated past performance and past performance is not a reliable indicator of future performance.
Without ever making more than 5%-8% per winning trade.
Without the high-anxiety of hoping a ‘big bet’ will come off.
What kind of difference would having something like that in place make to your own wealth building? And your own peace of mind when planning for the future? A meaningful one, I am sure.
The question is…
How is it possible to capture these small, common moves…
And transform them into big potential profits…
All WITHOUT using leverage to ‘juice’ your returns?
And never betting the farm, only ever risking half a percent of your pot per trade?
That’s what we’re going to cover today.
We’ll walk you through our new trading system that’s designed specifically to:
Identify small, strong stock moves, when they’re just getting started.
Provide you with a clear BUY signal so you know exactly when to pull the trigger.
Plus exactly where to set your stop level to keep a tight grip on the risks.
And there’s no need for any complex chart analysis – or ANY analysis at all – that’s all been taken care of for you.
Now this is trading. It’s not risk free. Even without using leverage, you can still lose money and your capital will be at risk.
But the backtesting we’ve seen suggests this is something VERY special…
Figures refer to simulated past performance and past performance is not a reliable indicator of future performance.
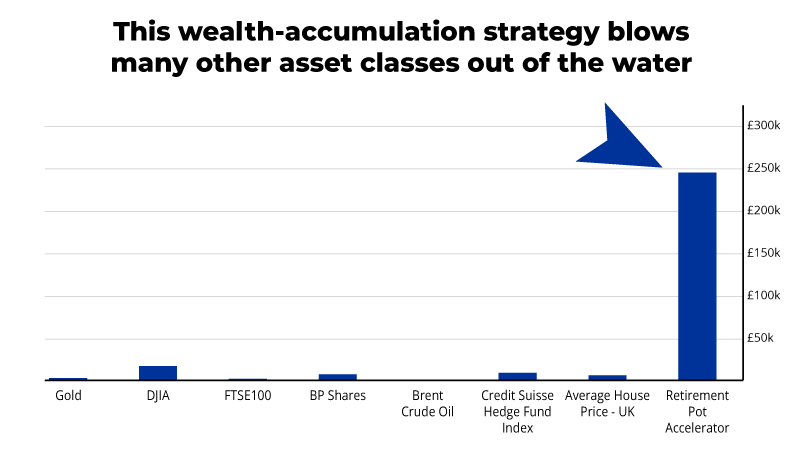
Beat the market? Over the last DECADE, our ‘Retirement Pot Accelerator’ would have crushed the market (in back-testing).
Since 2011, our backtesting suggests it outperformed gold…
The DOW…
The FTSE 100…
Oil… the Credit Suisse Hedge Fund Index… even House Prices.
And all, remember, without ever shooting for profits of more than 8%.
The method here is about stacking those small gains, pocketing the win, and moving on.
Never risking more than 0.5% of your overall capital per trade. That really is remarkable, I think.
I’m sure you’d like to know more about how this works.
That’s why I’ve invited the man behind this system to join me here at Southbank HQ today.
His name is Adrian Buthee.
If you don’t know him already, Adrian is a Director at TrendSignal, one of the UK’s leading trading education businesses.
For nearly two decades TrendSignal have taught home traders like you how to trade using their proprietary systems and techniques.
In that time, they’ve helped more than 10,000 traders – from novices to market veterans – learn to trade with more confidence.
Not only that, they’ve been voted Best Trading Education Provider for seven years in a row…
…and at the London Trader Show Awards in 2020 they were named Best Investment Education provider.
I’m delighted to say Adrian is here in the studio with me – Adrian, welcome.
You've helped thousands of people trade more successfully over the years. But the system that you're here to tell us about today is completely new, isn't it?
Adrian Buthee: Yeah, it's totally brand new. This is the unveiling, really, if you like. And like you've been saying, what it's really about is, I guess, not trying to shoot for those 100% winners. They don't happen very often… really hard to get on. Really hard to stay in as well, in my experience. So this is about going for those micro trends that happen all the time.
Nick O’Connor: Now, we'll talk about how the system works and what it can do for people in a second. But I think the first question, any reasonable trader sitting at home watching us today is going to have is how might a system like this perform in a really, really rough market? Because it's fair to say that this year has been a challenging one for traders.
So, let's answer that question right off the bat. How would this system have done in 2022?
Adrian Buthee: So, this year, in the US, we've had a bear market, so that's when a market's fallen more than 20%. I think at the moment the US indices are down 17, 18% or so. This system is actually up 89% cumulative profit this year, and that's down to the way in which it identifies trading opportunities. What's really important to note at this point, Nick, is that it is a long only trading system, so it hasn't achieved that through short selling.
It's done that by buying stocks and then looking to sell them at higher prices.
Figures refer to simulated past performance and past performance is not a reliable indicator of future performance.
Nick O’Connor: Just so that everybody's clear about how that might work. No shorting. So no betting on the markets going lower, no leverage. So no juicing up your returns by turning a small move into a huge profit with leverage and no big hundred 200% outlier winners. This really is something that flips that whole situation on its head, targeting those smaller, shorter market moves to make… I mean, 89% in a down year is pretty damn good, you'd have to say.
Adrian Buthee: Yeah, we're really proud of it. And I think it's really about understanding how these markets typically behave. I think a lot of us like the idea of these big 1,500% moves, but like we're saying, they don't happen very often. But the micro trends happen all the time. And despite the bear market that we have had this year, there's been lots of really nice, juicy rallies that our system has been able to identify.
So, for example, if we bring up the Boeing chart now.
Nick O’Connor: Yeah. Can we get that up on screen? Here we go.
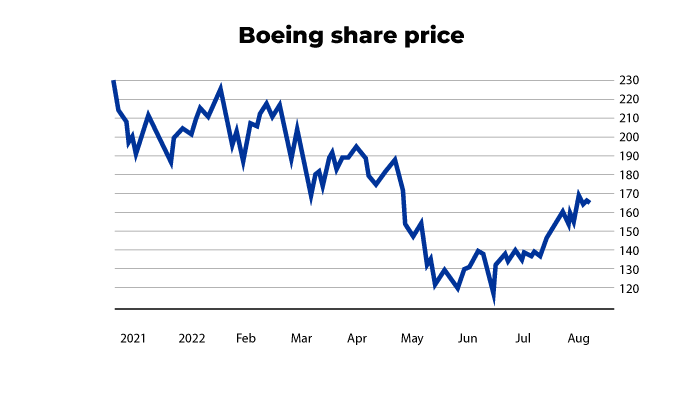
Five year annual performance of Boeing: 2017 +93.08% | 2018 +11.67% | 2019 +3.56% | 2020 -33.66% | 2021 +5.95% %.
Past performance is not a reliable indicator of future results.
So this is this is Boeing. I mean, I'm just going to say, before you even start talking about this… if I'm an investor and I'm looking at holding a holding on to a share, that's not exactly the kind of chart that I want to see of anything that I'm holding on to.
Right?
Adrian Buthee: No, I mean, that's had about a 50% fall this year, over that period you can see on the chart there. So it's pretty grim for investors and there's lots of stocks that are just like that.
Nick O’Connor: So you mentioned the fact that indices as a whole have fallen sort of 20-odd percent… that usually marks a bear market. But of course, lots of individual shares will have fallen by a lot more than that. Boeing is one of them. So let's overlay how your trading system could have helped turn that into a potential profit without shorting, because intuitively that doesn't feel like it would make a lot of sense.
Can we bring up the next chart and just see and move on one more.
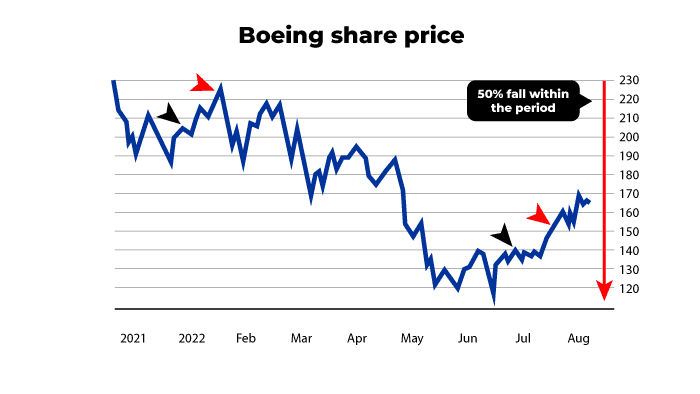
This is a back testing example. Simulated past performance is not a reliable indicator of future performance.
Five year annual performance of Boeing: 2017 +93.08% | 2018 +11.67% | 2019 +3.56% | 2020 -33.66% | 2021 +5.95%
Let's talk us through what's going on here because we can see the 50% fall mark there on the chart. But what's going on with these two arrows that we've seen?
Adrian Buthee: So with the white arrows – they're identifying the two entry points that our system has spotted. And they're both this year and they're both profitable trading opportunities. So what you're looking at there is generally an overall downward move for Boeing. But within that, there's been two or three really nice moves up or rallies within there, or micro trends, as we call them, both of which identifying really good exit points with the red arrows that you can see there. So despite a significant fall in the stock, we've been actually able to make some really nice profits, even long only.
Nick O’Connor: And I guess that speaks to the way that microtrend trading works because, you know, there aren't rallies of, you know, 50%, 100% within an overall bear market. Not too many of them anyway. Maybe the odd example, the odd outlier, as we've talked about. But, you know, these smaller, more regular, more obtainable, really, these smaller rallies that your system is trading, they are pretty common even when the overall trend is down.
Adrian Buthee: Definitely. And I think it's actually much easier to stay in them too. I think we as individuals are sort of predisposed to get a bit anxious when we're in a trade. We start to see it coming back the other way or it goes up a long way and we think, Oh God, we really need to be taking profits now just in case it goes back.
It can get a bit nerve-wracking at times for an investor, and I'm sure we've all felt that kind of emotion. This kind of plays into that in a way. It sort of accepts the system, sort of accepts the way in which we are as individuals. It identifies the microtrends and looks for what is probably more likely to happen.
Nick O’Connor: Yeah, moves of 5%-8%. They seem more obtainable as a trade. If you can get in and out in the right time frame, then trying to get into something that's going to move a lot higher over a longer period, it just feels more difficult to do, especially when the trend is down.
Why don't we just bring another example?
Because, I mean, you've looked at thousands of different trade examples in the backtesting that we're talking about. Scot, can we take a look at Salesforce?
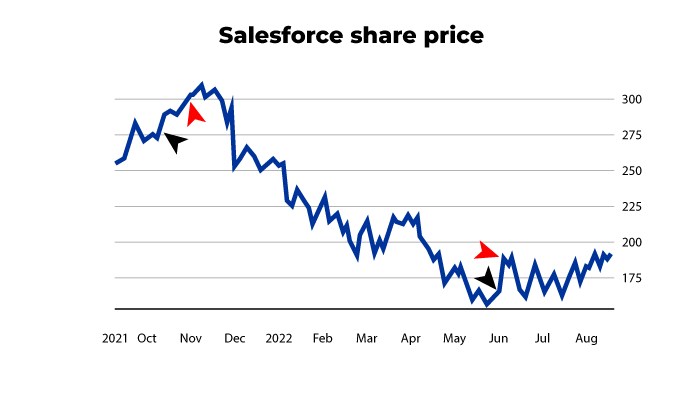
Back testing example. Simulated past performance is not a reliable indicator of future performance.
Five year annual performance of Salesforce: 2017 +49.33% | 2018 +33.98% | 2019 +18.74% | 2020 +36.82% | 2021 +14.2%
He's already ahead of me. There we go. And I mean, if the Boeing example that we talked about was a bad looking chart, then this is an absolute horror show. I mean, that trend is more or less straight down for the most part.
But again, you've got two examples on there of profitable microtrend examples. So explain, if you can, in a little more detail how the system might look for a trade like that in a down market.
Adrian Buthee: So what the system's always doing is identifying patterns. We look at about 60 different strategies within the system. So we're always looking at different patterns, different technical concepts to see what the balance of probabilities really suggesting. So the first trade back in October, November 2021, that was a nice rally, nice move in an uptrend. But as the market then starts to fall in early 2022, just big down trends coming through.
And actually that's why you'll see fewer trades there. The system is not identifying new opportunities because the risk is just not in its favour at that point. It's only when the market starts to show some more signs of life that we then get that buying opportunity. What was that beginning of June or so? For really nice winning trade again and again.
Nick O’Connor: You're in and out in a relatively short period of time, not with a huge profit, but with a small one. But you know, you generate enough of those over time that you can really start to see some big long term cumulative profits. And we we've already looked at some of those today.
Figures refer to simulated past performance and past performance is not a reliable indicator of future performance.
So it makes sense that, you know, if you find enough trades like that, then the testing suggests could have made 89%.
And that's to the end of August this year. I mean, that's before costs and taxes, which we'll talk about later. But I mean, Adrian, most traders would give their right arm to make 89% in a year like this. So it certainly seems like the system is on to something. I think it's worth setting that number in a little bit of context because I think most people know it's been a tough year.
Not everybody will realise just what a hideous year it has been. So, I mean, the first half of 2022 was the worst year for stocks in half a century by many measures. When you pan out and look at it, it's no surprise when you've got war breaking out, inflation hitting four-year highs, interest rates headed up.
But when you talk about trading microtrends, that's what I see the beauty of the system is. Because there’s always going to be opportunities out there. And you sort of alluded to this a second ago: the secret to finding those sorts of trades is always going to be the raw processing power of a system.
And you talked about 60 different indicators that your system looks at. Of course, no individual trader could ever synthesise 60 different ways of trading across, you know, scores of different stocks, all moving in different directions at different times. So let's go right back to first principles. What is it about systematic trading and this system in particular that you think could give people such an edge?
Adrian Buthee: I think you actually kind of mentioned it earlier. There's an awful lot going on this year and we probably think this year is different to every other year. But there's always something happening. And it's that, you know, the fear of inflation, the fear of interest rate change, the fear of a recession, the fear of a war, a pandemic. I don't know.
It always makes us, as investors, quite irrational. And I think this is what holds a lot of investors back. A system, by contrast, is rational. It only looks objectively at what is actually happening and what the charts are telling it… what the price action tells it… what the indicators are telling it… without getting bogged down into how we might feel, which frankly is irrelevant.
You know, nobody cares how you or I feel about an individual trade we might do or what might happen to the Salesforce stock… because the market's going to do what it's going to do and the system will react in the same way.
Nick O’Connor: But of course, processing power plays into that too. I mean, I don't know how many people you have backing you up over at TrendSignal, but I know just from experience and talking to you that it's a pretty decent sized team both here and abroad. So, tell us about how they support the efforts when it comes to building a system. Because you must be looking at a lot to synthesise 60 different trading strategies across so many different stocks.
So you must be looking at vast amounts of data.
Adrian Buthee: Absolutely. So we've got over 20 of us in our team in the UK and in Hong Kong. And what we really are, are traders, analysts, developers, and our primary focus is looking to identify strategies where we have an edge in the market. That's what we do. So, we'll be analysing thousands of trade set ups. I mean, if you think about all the indicators and technical analysis patterns that are out there… probably most of us have heard of moving averages, relative strength, Bollinger bands… there are hundreds of different indicators.
There are hundreds of settings which gives us, I don't know, probably millions of different combinations. It's a real minefield out there for an individual to really try and work it out for themselves. And what you often find is that someone will try and test something out and maybe look at it for maybe a month or a few weeks and think, oh, that’s looking pretty good, but it really is over a very micro – using that word again – point of time.
And it's just not enough, unfortunately. What we do is we analyse thousands of trades over decades to look for where, like I said, the system really gives us an edge. Looking at a lot of things that most of us are familiar with longer term trends, chart patterns, candlestick patterns, momentum, the degree to which markets are overbought, oversold. Like I said, we've got about 60 different strategies that are built into this system to help us to identify the highest probability opportunities.
Nick O’Connor: And all of that in backtesting adding up to an 89% profit in a year like this. is nothing to be sniffed. And if anything, the backtesting that I've seen in an up-market is even more compelling. So in 2021, which is a much more favourable year for traders in general, the trend was overall up across the stock market.
The cumulative profit this system generated was 389%… so significantly more. But in conditions that were more favourable to trading. In 2020, so the year of the pandemic, which had, you know, both a massive crash and an enormous rally, the overall cumulative profit was 334%. So, those numbers would suggest that this really is an approach that can work in an up-market, but also in a down market.
Figures refer to simulated past performance and past performance is not a reliable indicator of future performance.
And I guess the reasons for that are some of the things that we've been talking about. You know, you don't need a 100% rally in a stock to make money this way. You don't need months of rising prices because it's a short term trading strategy. And as we've seen in some of the examples that we've looked at this year, you don't need the economy to suddenly improve or inflation to disappear or, you know, recession to disappear off into the distance.
All you need to do is find one of these microtrends, get in at the start of it and walk away potentially with a profit five, seven, ten days later. I just thought we should bring up on screen some of the overall numbers that our backtesting generated. We've dug into some examples and some yearly data, but let's look at the whole data set from 2011.
Scot, can we get that up on the screen just for us?
Figures refer to simulated past performance and past performance is not a reliable indicator of future performance.
And so, as I said, the cumulative profit overall was 2,459% since 2011. What I found really compelling was that the average winner here was just 5.3% and the average loser just 2.2%. So talk to me a little bit about how that's possible.
Adrian Buthee: It's really down to the analysis of the system. So we just looked at all the trades that a system identified over the period. Remember, in the main, we're looking for 7 or 8% targets and objectives for our opportunities for those microtrends. So some trades we exited a little bit before then, but yeah, on average 5.3% over the period and nice tight stop losses as well.
So, when a trade is not going the right way, we will be looking to close those trades out quite early before they tank. You saw some of the examples of Boeing and Salesforce earlier that if you don't cut those trades off they can get pretty bad pretty quickly. But of course, that's where stop losses come in and the ability to close those trades out on the early warning signs that it's going to start to go the wrong way.
Nick O’Connor: We'll come back to the concepts of stop losses, because I think there's something clever going on that I wanted to talk to you about. But it's worth pointing out that if the average winner is 5.3%, the maximum winner a system like this is shooting for is only 8%. You know, if someone was to tell you, if we'd go out on the street today, pull somebody in and say, do you think you could make close to 2,500% profit over ten years, never making more than 8% per trade or never even shooting for 8% per trade.
I don't think they would think those numbers work out, but it really is testament to finding enough of these winners, cutting those losers short and getting in on those winning traits that if you do that with enough consistency, you can do incredible things over the long term.
Adrian Buthee: Absolutely. I think, you know, that the 100% winners, they sound great in headlines. You know, it sounds wonderful to tell all your friends about this amazing big win you've had, but they don't happen very often. They don't generally suit us as individuals. They're not easy to stay in. There’s a lot of times, you know, where… my own experience is that you end up closing out a trade because maybe you get a bit nervous.
And I'm the same as anybody else, you take the profits and it's really hard to stay in those trades. And that's the same issue that the vast majority of investors will have time and time again. But we don't have to trade that way. There is a significantly better way.
Plus the other thing that a lot of people don't necessarily realise is that once you've closed that out, then you can look to then allocate that capital to the next opportunity and then the next opportunity. So the more times your investing, the more opportunity you actually have.
Nick O’Connor: And I think it's worth us just flagging that average losing position because, you know, this is trading. Trading is risky. Of course, there's no leverage involved here. There's no shorting or CFDs or options. So that does you know, those things are generally considered to be much higher risk because, you know, your losses can exceed your total capital.
There's none of that to worry about. But there are the regular risks of investing. If something goes down in the markets, move against you, you can lose money. 2.2% doesn't sound like a massive sort of average losing position, in the same way that 5.3% doesn't sound like a massive winning position. But actually the trade- off between winners and losers is really quite favourable here, isn't it?
Adrian Buthee: Definitely. And I think it's worth comparing that against something like 100% winner. The same ratio would probably be what, a 30% loser. So if you're going to go for the big winners, then you've got to accept that you're going to have some pretty big, horrible losers as well. You can't really have it both ways. Whereas this system is all about trying to keep the risk tight.
Figures refer to simulated past performance and past performance is not a reliable indicator of future performance.
And you think about the 5.3% versus 2.2%, that's a really nice reward to risk ratio. And that's that that's the thing that just helps it all keep ticking over as it has done over the last, what, 11, 12 years or so.
Nick O’Connor: And if we just bring the backtesting that we've done, the cumulative profit figure back up on screen, I mean, you can see 2,459% cumulative profit over just about 11 years. I mean, that's what happens when you can get in on enough of these trades and consistently trade them over time. Good markets, bad markets, sideways markets. If you can just keep your money growing.
Figures refer to simulated past performance and past performance is not a reliable indicator of future performance.
I mean, we're all looking for ways to make our money work hard at the moment with inflation and various other things going on in the economy. If you can just keep doing that consistently, it doesn't really matter that you're not swinging for that big 100% winner, that big 1,000% winner. You know, I think in a bull market, you hear a lot about those sorts of things.
You don't hear so much about them this year. You don't hear about the next crypto going up 1,000% or stock doubling over. It's really, you know, what stuff is showing relative strength compared to an overall down market. So if you can kind of just change your mindset, the big potential profits are there over the long term. But on a trade by trade basis, you're just approaching things in a much more realistic fashion, aren't you?
And I guess the question is, you know, how is this possible? So we've talked a bit about the system and the different indicators, but I just wanted to delve into that a little bit more. You know, how do you go about building a system like this? Because you talk a lot about the data and the backtesting. You know, this isn't something that's just been scribbled on the back of an envelope.
It's not something that you've just come up with overnight and dreamed up. It's really the result of, you know, hundreds and hundreds of man hours of work, isn't it?
Adrian Buthee: Yeah, very much so. So, I joined TrendSignal in 2004 and it was already an established company then. So I joined the team and you know, what I saw was something incredibly different to any trading that I'd been doing before, which is probably maybe what a lot of other people have experienced, which is just trying to DIY really.
But the concepts we use in the system we've really been using in some form since TrendSignal was established 20 or so years ago, which is all about looking at the direction in which prices are going and then trying to then establish… if prices are starting to rise, why would it go up from here? You know, I think sometimes you look at how you might bet on a sports event or something like that, you might look at whether that particular team is in form or whether it's got a, you know, brand new signing who's going to be brilliant or a new manager that's going to be great, or whatever it may be, a new stadium, perhaps… It's very hard to look at the equivalent things when it comes to trading, but that's what we do. What are the equivalent things? Well, we look at longer term trends, we look at chart patterns, candlestick patterns, analyse Fibonacci, we look at the degree to which markets are overbought or oversold. All of these things are factored into the context of a move, if you like.
So whenever we start to see a market rising, the algorithm will then start to analyse what's happening at this point to suggest that this rise is likely to carry on and it's likely to go on to be a big winner.
Nick O’Connor: So, I mean, you've mentioned and touched on a few things that I'm familiar with and that lots of people at home will probably be familiar with on some level or another. So trading momentum or Bollinger bands or moving averages or whatever. But I guess really what you're saying is that individually, those things are not enough.
You know, they are they are easier to grasp as an individual. Perhaps if I was at home and I was trading, I might use one or two of those indicators. But the advantage of a system that's able to look at vast amounts of data and apply increase to well processing power to that data can look at.
Okay, I don't want to just say, you know, a tick in one box. I want to see a tick in 10, 15, 20 boxes. You want to see as many different factors that indicate a potentially winning trade lining up as best as is possible. And it's not really realistic for any human brain to do that. It's kind of something only a system can do.
Adrian Buthee: I think the thing is that any of these things can probably work for a short period of time on their own, you know?
Nick O’Connor: Like meme stocks. You might say, well, meme stocks are hot at the moment. I'll trade them.
Adrian Buthee: Or you'll have a few examples where trading, I don't know, moving average crossover for example looks great. You know there's a couple of brilliant examples but actually if you looked at it over a longer period of time, it's probably horrible. And it's the ability to know when to use that. So that pattern that you might have identified might be really good if you start to bring in two or three other concepts with it, it works really nicely when this is happening and this is happening and this is happening, and suddenly you've got yourself an edge with your trading strategy.
So, it's the ability to bring in a number of those elements to try and sort of add weight and consistency to a strategy over a significant period of time. That's why the system that we have here is a blend of multiple strategies that have helped us to identify profits, not only in the downward markets that we've talked about and done really well, nicely on those, but also when the markets are going up, too.
Nick O’Connor: And of course, there's this phrase in the financial markets that that the past performance – and actually we're talking about simulated back tested past performance here, so as a subset of that – isn't a reliable guide to future results, which we all know. But of course, you wouldn't want to trade something that hadn't worked in the past, because that doesn't make sense either.
So, you know, you kind of have to go back and look at what has worked to try and figure out what might give you an edge in the future.
Adrian Buthee: That's exactly what you have to do. Otherwise, it's just a gamble, to be honest with you. And that's what things like stop losses are for. That's why we do the rigorous amount of testing and analysis that we do, because you have to. Otherwise it just becomes a gamble.
Nick O’Connor: I mean, how many man hours are we talking here? Because I can't even really build a working spreadsheet, never mind test something over thousands of, you know, trading days, different securities. Talk to me about the amount of time that you have to invest in building something like this, because it just doesn't seem like something I can even really comprehend.
Adrian Buthee: I think it probably is quite hard to actually put a specific number on it other than to say – the group of traders, if you like, have really been together for sort of 18, 19 years now. So it's the experience and time and analysis over that that period that saying come to this point of launching this system now.
And this is methodologies that we've been using for that period of time. So if you think about a team of, you know, 20 or so people that have been using these techniques in some form since 2003, that is a huge amount of man hours analysing rigorously all the different trading opportunities and technical set ups that are there.
Nick O’Connor: And I'm guessing refining along the way as the markets change things up.
Adrian Buthee: Absolutely.
Nick O’Connor: Shall we take a look at some more examples? Can we get Nvidia up on the screen? Yeah. Let's take a look at this. So we've looked at we've looked at some examples of really, really, you know, poor markets, down trends.
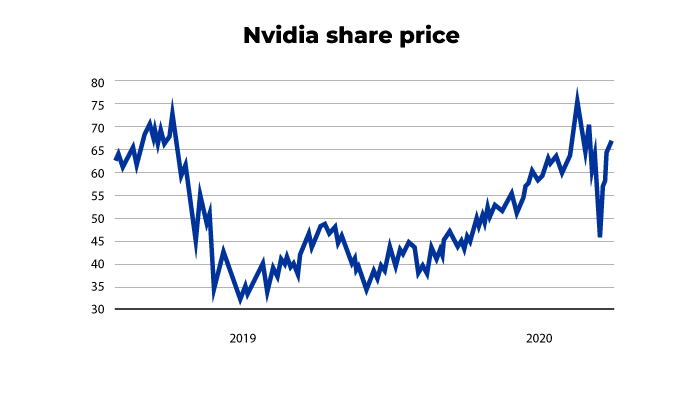
Five year annual performance of Nvidia: 2017 +81.82% | 2018 -30.69% | 2019 +76.73% | 2020 +122.2% | 2021 +125.41%.
Past performance is not a reliable indicator of future results.
If anyone at home does know is a is a big technology business listed in the USA. So here we've got a big down move, a kind of sideways move, and an upwards move. And as an investor I don't look at that and think, Oh, I wish I owned that.
There were obviously moments in time where the share price was rising and you know, you would like to own it. Why don't we overlay on top of that where this system would have would have locked onto a trend? So you go on to the next slide for me, Scot. So, we've got sort of four examples here. I've got some questions for you, but before I throw those that you talk to us about what's going on because these aren't all winning trades.
Adrian Buthee: Yeah, absolutely. So Nvidia is pretty flat over that period of time. So investors pretty much break if they've managed to stay in it. But what you've got there is the first trade on the left hand side. That's a buying opportunity which ended up being a loss making trade. And it's important to cover that, you know, any systems going to have loss making trades.
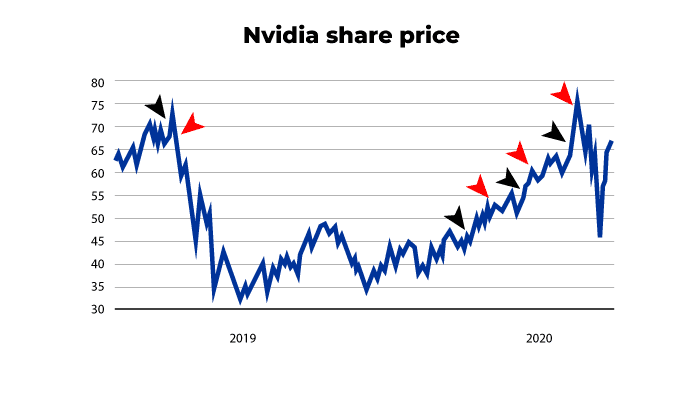
Back testing example. Simulated past performance is not a reliable indicator of future performance.
Five year annual performance of Nvidia: 2017 +81.82% | 2018 -30.69% | 2019 +76.73% | 2020 +122.2% | 2021 +125.41%
And what's happening there is that the market was in an uptrend. It stopped, the market then broke down and then, well, as you saw then let's see what a what is that? It led to probably a 55, 60% fall over the next few months. But the system got us out, got us out effectively. But you’ll also notice is, as the market then started to rally, then there wasn't any new trading opportunities for a little period of time.
Nick O’Connor: So, we're talking the after the sort of cratering in late 2018 and then around 2019, the market starts to recover. That's what we're talking about, right?
Adrian Buthee: Yes, exactly. And it's important to realise that what the system is doing is it's always analysing whenever the market starts to tick up a little bit. What's happening now is probability on our side, you know, looking at the way in which these stocks move, the way in which they have done over thousands and thousands of trades, is that a repeatable pattern?
Is that a pattern that's historically produced good trading opportunities? Simply put, if the answer's no, then we don't get a trading opportunity and we just don't have that for a little while. Despite the fact that Nvidia has moved up a little bit. Really, what's happening here is that it's not until the second trade, the first on that right-hand side of the chart there, that we actually end up with a higher probability pattern repeating itself.
Prior to that, it's just a lot more uncertain.
Nick O’Connor: I think that's something that I know from talking to traders and having worked in this industry for a long time, that people do struggle with their systems because they think, well, why wasn't, you know, the share price was rising in early 2019… why were no trading opportunities triggered? And I'm guessing it's you know, if you're looking at 60 different indicators, maybe five of them would have been triggered there.
But that's kind of not enough for what you're looking for. It's not enough to get a good indicator. You want to get a great indicator, right?
Adrian Buthee: It's always easy to look after the event and say, oh, he should just put it there. That would have been so much easier. First of all, did you know? Probably not. It’s easy after the event, but really hard in the heat of the battle, as it were. The thing about that low, there is sort of the tail end of 2018, beginning of 2019.
Is what's happening around that low there… Sure, that first move ended up being quite a big move higher. What we're not really acknowledging here is that that pattern that identified that move higher is not a consistently top performing pattern or it's very inconsistent. So, what I mean by that is whatever that type of pattern, what's happening there may produce one winning trade for every seven losing trades.
We just happen to be seeing what might have been a winning trade here. The point is, for every one of those, you're not seeing the seven losses which would have made that type of pattern a loss-making pattern.
Nick O’Connor: You always want to look back at the previous ten times that set-up had occurred and say, well, what happened? I want to know what happened after every time we saw that.
Adrian Buthee: And you have to. It's easy to look at that one and say, well, if you should have got on that, you know, this system's rubbish. Well know because we're not looking at all the information that we have to look at, which really comes down to consistency. So, what comes into our system is the strategies that that build our system or that blend our system, have consistently produced the right result.
And that's important because what you don't want is something that's overly erratic and you don't want to be just going for, you know, I can't think of the right phrase here, but just, you know, the real long shots. That's just not what the system is really all about.
What you then notice as that first trade then kicks in on the right hand side that what actually is happening there is that the system has identified the Nvidia is actually now in a nice strong uptrend and as it continues to move higher every time it has a little pullback and then gives us another entry and other entry wave, so you end up with three really nice winning trades as the market kind of normalises again, should we say?
What I really like about this though is that we're not necessarily going to be in every move and why that might have been a big rally, it's only fine if you're actually in it. And so you might well have missed the first trade. You might have missed the second one, but it's giving you that second, third, fourth entry point that allows really any investor and any trader to be able to get on it.
Nick O’Connor: And I know this from personal experience that when a market is moving higher like that, unless you buy at the beginning… and you're coming at this with an investor's mindset, perhaps that's my problem, the investing mindset… Once the market starts moving higher, it becomes difficult to buy in because you think, well, I didn't buy when it was 20% lower.
I've missed it. I'll have to wait for the market to come back to where it was when I first thought about buying, rather than having this approach where it's a lot more rational, a lot more systematic, the system does not care that you didn't buy it 20% lower. It's just identifying the set-ups are good right now at this point in time.
So, it gives you that second and third bite of getting into something that's maybe higher that perhaps you would actually miss out on. I think we've probably all experienced that. Right? Why didn't I buy X when it was lower? We see it all the time.
Adrian Buthee: This is kind of like trying to swim downstream. You know, the market's already moving enough in that way. So just join it. Just allow yourself to get on that next opportunity. And it is a different mindset. Investors are very much, you know, buy low, sell high, whatever that's supposed to mean, whereas with traders, it's buy high, sell higher. You know, we want a market that's already going the way we expect it to go and it’s going to jump on it.
Nick O’Connor: Definitely. It's a great example. Let’s look at Home Depot.
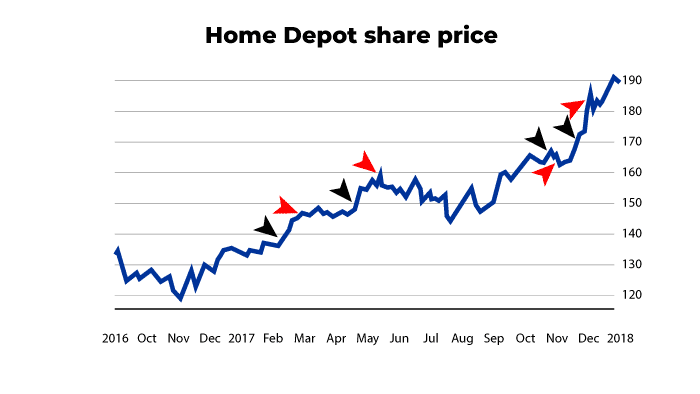
Back testing example. Simulated past performance is not a reliable indicator of future performance.
Five year annual performance of The Home Depot Inc: 2017 +44.01% | 2018 -7.17% | 2019 +30.26% | 2020 +24.38% | 2021 +58.73%
We talked about Salesforce being a bad chart, but this is a pretty good looking chart if you're an investor as to the type of thing we all want to own.
It goes from the bottom left to the top right. Lots of people have the natural objections to things like this, say, well, I could have just bought it at the start and held on all the way through, you know, why bother fiddling around, trading it?
Adrian Buthee: Well, again, it comes down to the fact whether we were long, because if we weren't long back at the end of 2016, it's a moot point, isn't it, really? Because the end of the day, we need to have something, you know, I like the phrase a repeatable entry point, which is something one of our coaching team said once. We need something that gets us into the opportunity in the first place.
And that's got to be something that's based on reason, statistics and so on. Otherwise, it's just hindsight. And the question is, can you repeat that hindsight? Well, no, not really. You can't do it live, can you? And that's what this system does. We're never going to get the low every time, but nobody can. But what it is about is identifying when the market is showing those patterns, repeating themselves again and again like it does, you know, a handful of times here on Home Depot.
Nick O’Connor: And I guess one thing that I always find very compelling about a systematic trading approach is that, the system isn't reading the news. It's not looking at, you know, I'm looking at 2016 and I'm thinking of Donald Trump and all the exogenous factors that we seemed to get back then in the stock market. A tweet went out or a strange press conference and markets would move based that and it became very difficult to know what was going on.
But of course, the system isn't getting distracted by the media and by the sort of circus that surrounds the markets. Sometimes it's just looking for those high probability entry points.
Adrian Buthee: That there's always something that's happening there. And Donald Trump is a classic example of that. You never know when he's going to shoot from the hip with his Twitter accounts and say something that's going to rock the market. Equally, I know sometimes looking at the charts and they've never been smooth or when in the U.S. and they, you know, they couldn't they couldn't release nonfarm payrolls because they couldn't pay the staff in order to release the data.
The whole thing can be a little bit strange. There’s always something happening there. But the system doesn't look at that. It doesn't think about it. That's going to put you and I off, isn't it? And it will have done in the past. But the system just keeps it true, keeps it honest and looks at exactly what the market is telling us.
Nick O’Connor: Shall we look another example? Of course, everybody's going to get the chance to try this out for themselves. But I think we had Netflix somewhere in our slide deck, right?
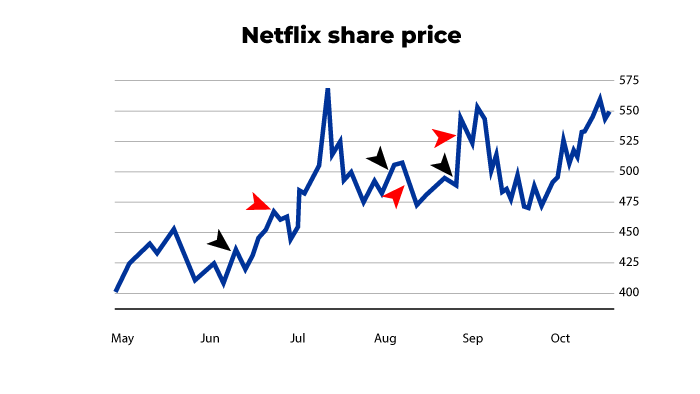
Back testing example. Simulated past performance is not a reliable indicator of future performance.
Five year annual performance of Netflix: 2017 +55.06% | 2018 +39.44% | 2019 +20.89% | 2020 +67.11% | 2021 +11.41%
So we can see Netflix there on the screen. It's a little bit harder to decipher, a little bit choppier, perhaps some of the other examples we've looked at.
But again, the system seems to be able to lock on to repeatable entry points.
Adrian Buthee: I think it's actually really interesting what you just said there. It’s a bit to decipher what's going on. Absolutely. But we're humans. You know, that's the way we look at the chart. It is hard to decipher. But again, within there are certain things that are happening that the system is identifying, that the indicators are identifying, that the combinations we look for identify, help us to identify, you know, two winning trades and one very small loss making trade.
And that's, again, the important point. There's two nice good sized winners. One, tight loss, which is down to, again, that reward to risk ratio that we're quite keen on here.
Nick O’Connor: So again, I mean, you're not swinging for the fences, you're not going for these huge possible potential winners. You're just going for a repeatable, predictable to a large extent, microtrend winners. That doesn't eliminate losses. I mean, we all know that. We all know that any form of trading is going to come with its risk of loss.
And this is no different. But overall, we look back at that cumulative profit figure that we talked about earlier, you know, 2,459%. That's what really matters, that over time, if you trade these small market trends, get in and out in a timely fashion that you can make some really big, long term cumulative profits trading really pretty small moves. And I think that's what I find most compelling.
Figures refer to simulated past performance and past performance is not a reliable indicator of future performance.
Now in a second, we’ll take a look at how you can take that 2,459% cumulative profit and double it without using leverage, which I know sounds impossible but is actually really easy. So sit tight. That's coming up. But first, I want you to just imagine what system like this could do for you.
Imagine trading in and out of microtrends as they unfold over 7 to 10 days, aiming to walk away with consistent, regular profits, even in challenging market conditions, and without worrying about leverage or needing some long shot bet to come off. Just think about it. What would that do for you? How might that change your approach to the markets and your money overall?
How could that impact your trading account? Yes, you'd be free to punt on the next stock that could double every now and again. But you'd also know that you had a rational, data proven strategy for moving your money forwards every single month, and that is what is on the table for you today. Now, just remember, this system has never been shared with the public before.
So you really do have the chance to gain an edge over the rest of the market here. You've seen our backtesting and I hope by now you started to see why we’re so excited. So in a second, I'm going to give you the chance to give this a spin for yourself. That's coming up. First, though, let's look at how and why this system works and how you can start using it yourself.
So, Adrian, you know, we've made the point several times already today that this isn't about swinging for the fences. It's about trading those moves that the markets just make all the time. You know, I don't know how many hundreds of times stocks move by, you know, between 5 and 10%. But it's obviously going to be a lot more than the number of times the stock doubles or triples or whatever just in the laws of statistics suggest.
Figures refer to simulated past performance and past performance is not a reliable indicator of future performance.
We’ve talked about like cumulative profit figure, which was 2,459%. But it turns out you actually could have made more money than that, trading the system with just one tweak to the way that you approach things. So one of the tests that you and the team did suggested you could have turned a £10,000 trading account into a £575,000 profit over 11 years using the system.
Now, as we said before, this is excluding costs and taxes. But my question is, how is something like that possible?
Adrian Buthee: This would be through compounding. So compounding is when you look to increase your trade size as your account grows. For example, the data that you went through there was based on risking half a percent of your account on each trade. That's the amount at risk based on the stop loss level, that would be risk on each trade.
But crucially, the percentage risk remains the same. But as your account grows, the monetary risk can actually increase a little bit. So, what that means is, let's say you started with £10,000 on your account, 0.5% risk would be £50 risk. If your account grows to £20,000 and that same 0.5%, same percentage term risk would then be £100, which broadly speaking, means you're going to be doubling your trade size, all other things being equal.
And then at £100,000, that would be a £500 risk, but crucially, the same 0.5% risk. So effectively as your account grows, your trade size can really look to grow, which means the potential profit can look to grow as well.
Nick O’Connor: What I love about that example was two things. One, it underlines why Einstein called compounding the eighth wonder of the world, as everybody knows, because the numbers almost don't make sense when you first think about them. I mean, we all know that people struggle to understand the compound exponential function. But what I like more than that is actually that it implies a long term way of thinking about your trading approach.
You know, this isn't the sort of thing where you're trying to make a quick buck swinging for the fences on an opportunity to try and triple your money, or whatever it might be, and then get out of the market. It's actually the exact opposite of that. If I think about this as a long-term project and I keep trading successfully and consistently, my account will grow and all I have to do is grow my risk with it, almost.
Adrian Buthee: Especially when you recognise that we're only looking for 5 to 8% gains on each trade as well. So, it's easy to think about those numbers when you think about massive winners, the system's not looking for that.
Nick O’Connor: So, if you start with a small pot of, say, £10,000, you know, that was sort of a notional amount that you used in the testing. Obviously, if you're only risking £50 per trade your profits are only going to be small, your risk is only going to be small. That's part and parcel of starting small.
But all of those things will grow as time goes on, assuming the system delivers the kind of results that the backtesting suggested. So, by the time you grow money in your account, your risk in monetary terms is going to be higher and your potential returns are going to be higher.
Adrian Buthee: Yes, absolutely.
Nick O’Connor: So as your pot grows, you're able to grow your account with confidence. And that's one thing that I really liked about that.
Now you are trading a lot with something like this, by virtue of the fact that you're only shooting for between five and 8% per trade. To really grow your account over time and really make your money work hard, you need to be trading a lot.
So trading costs then become a factor. Now, we talked about, you know, the numbers and we've said these exclude costs and taxes. Let's park taxes for now because tax is different for everybody. It depends whether you're using an ISA, which I think you could do something like this or not, or whatever your personal tax situation is. But costs are going to be a factor for everybody.
How do you go about addressing something like that?
Adrian Buthee: The thing is, there are plenty of brokers out there now as they become very, very competitive in the broking world. So there's a lot of almost even free brokerage services that are available now where you can keep the costs down to extreme really low levels, like I said, or even pretty much free to allow us to trade without really much of a concern on the cost side of it, if you had the right broker account. But of course, that's something that we can help with as part of this programme as well.
Nick O’Connor: But it is a factor, as you know. If your existing brokerage charges, a large fee per trade, let's say it's one of these really old fashioned places that charge £20 or whatever. If you want to start with a small amount of money and you're paying that amount in costs per trade, that is really going to eat into your capital, so that's worth flagging up.
Doesn't have to be like that. I know that there are now trading platforms where it's almost like a subscription. You pay a monthly fee or a yearly fee and trading is free within that. So that kind of caps your costs. But that's something people at home need to be aware of. If they're going to make this work for them, they need to factor in costs.
Adrian Buthee: Definitely a minimum commission charge of £10 to £20 is fine if your account is quite big because it turns out to be negligible. But actually what you're really better off doing is trading with a broker where that's very low or there is no minimum. So that means that you can trade from one share potentially if you wanted to, and then the cost can be extremely low accordingly.
And the good news is there are plenty of brokers out there that can allow you to trade like that.
Nick O’Connor: And if people want to give this a go, you have a team ready and waiting to help them make the right decisions, for them when it comes to finding a lower cost broker. So that's good news, but of course, is a factor. Now, there's another thing that, you know, eagle eyed people at home watching today may have noticed, which is all of the stocks that we've looked at have been, you know, large, very, very liquid stocks.
And we're not talking about small caps. We're not talking about highly volatile securities here, but they are also all listed in the US. Now, that brings advantages and it brings complications in some facts. Let's just through them. So, first of all, why is that? Well, why is it that this system works best in the US large cap market than, say, the large cap UK market?
Adrian Buthee: They just move differently, Nick. We find that the UK stock market can be a little bit more jittery. It doesn't tend to move quite as smoothly as the price action on the US stocks. It's a lot more participants in the US, it's a much bigger retail market… huge institutions trading it… very, very popular stocks globally. And what that means is that when these stocks want to move, they move and they move really quite consistently and, you know, and smoothly.
And it's that dependable-ness, if that's even a word, that allows us to actually trade them with a great deal more confidence. And the data just simply backs that up.
Nick O’Connor: Yes, I think I saw in some of the testing that I took a look at that for every 1% the FTSE100 has risen in the last ten years or so, the US stock market has risen by about 7%. So that's not just anecdotal, you know, the data bears out, these stocks move a lot more now.
We’re talking about really, really big household names, you know, Boeing and Nvidia, Netflix. You know, these are not unknown stocks at all. So they are very easy to buy. Most of them going to be ISA eligible. So there's not going to be any issues that they're not going to be over the counter things not going to be super, super high bid spread and stuff.
You don't need to worry about those kinds of risks. Of course, there is a foreign exchange risk associated with those. If anybody doesn’t understand how that works, if you're buying a stock that's denominated in dollars and the dollar moves, but the stock doesn't, then you can make a profit or loss based on that dollar movement rather than the stock itself.
But really, we're talking about being in these trades for kind of between seven and ten days. So the likelihood of a huge move in the currency markets in that time is relatively small, I would imagine.
Adrian Buthee: Yeah. And certainly not the sort of degree that's going to offset the profits that might be available on an individual trade. So it's certainly not something I tend to be too concerned about. In terms of the stocks that we're trading. Broadly speaking, it's the S&P 100, so the biggest 100 biggest listed stocks in the US. So, they are really the household names that you'll be trading.
And the great thing about that is the vast majority of major brokers will offer these you know.
Nick O’Connor: It would be unusual for a broker not to offer Netflix. It would be very, very unusual.
Adrian Buthee: Or Apple or Amazon or, you know, something like Coca-Cola. These are these are major stocks that are listed with many, many brokers.
Nick O’Connor: So these are big liquid, large caps. So we've not got those small cap risks and we've not got the volatility that's often associated.
Adrian Buthee: Absolutely. Yeah.
Nick O’Connor: I actually find that to be a really compelling part of this strategy because sometimes people associate trading with volatility, looking for markets. They're going to move 20% in a day. There’s lots of small caps that can easily move 20% in a day. You’re not shooting for even that, not even half of that.
I mean, 5 to 8% in, you know, a week or a week and a half, that's a lot more of a modest goal, but it does just feel that bit more obtainable.
Adrian Buthee: I think that's the thing. If you're looking at those real micro stocks, you know, the real small stocks, they might move up 20 or 30% in a day, but they might fall 20 or 30% in a day too. And that’s the problem with stocks that are like that. I kind of liken it this way that with technical analysis, the more data you're analysing, the more accurate your findings are likely to be.
So, if you're trading, or looking to trade or analyse a stock that trades quite infrequently, you're not really analysing much data. The results become far more inconsistent. And that's the problem by trading small caps is that they can be very erratic and much more like a gamble. The big cap stocks, they may not sound quite as exciting, but they're a whole lot more dependable and a whole lot more low risk, which as traders and investors we should be big supporters of.
Nick O’Connor: Yeah, absolutely. And so those are some of the risks associated with this. And let's talk about exactly how people can give this a go. So, if they want to try the system out, there are a lot of advantages in the sense that all of the hard work is really already being done for them and will be done for them on an ongoing basis.
People will receive a specific trade alert with a profit target, stop loss and then a dynamic stop loss if something goes wrong. So can we talk through each of those things in turn? The system triggers an alert, there's a buy alert that goes out, they get the ticker symbol, they get the profit target. So let’s start there. What exactly does a profit target tell me?
Adrian Buthee: So that's where the system expects this market to get to. It's effectively it's like looking at the most likely scenario for this opportunity. Again, it's not looking for that 50-100% move because that's just not very likely. We're looking for what is likely. The system will give a level that you could literally copy and paste to your broker platform so that if the price gets to that level, the broker can then automatically look to close you out of the trade.
Nick O’Connor: And the other side of that coin is a stop loss.
Adrian Buthee: Yeah.
Nick O’Connor: I'm guessing that that can be set up in a similar sort of way when you enter the trade.
Adrian Buthee: Exactly. So again, you know, modern brokers now… if you find a good broker platform, which again is something that our team can assist you with, is that then you can put your stop loss in. And again, if the price then starts to go against you to a level where… it's a bit like saying it's going a bit the wrong way, don't really want to be in this trade anymore because it's probably going to get worse. That's really what the stop loss level is. So, again, you can actually copy and paste the level from the alert that’s sent to you, put that on to your broker platform. So when the price gets that level, the broker can then look to close you out.
Nick O’Connor: So, if we were to just put that into the terms of an example, you might be given an alert that says something like Buy Apple at $100, sell it for a profit of 107. Sell it for a small loss at 97.5.
Adrian Buthee: Yes.
Nick O’Connor: So your that's your profit target of 107 and your stop loss at 97.5 or whatever. I don't know why put the half into that? You know what I mean. We've got a profit target above you and a sell level below.
Adrian Buthee: It’s exactly that.
Nick O’Connor: So you've got your target and your stop loss. So those are the two ways. Well, the first of two ways you could actually trade with a profit or with a small loss, where does the dynamic stop loss come in to that situation?
Adrian Buthee: Again, what the system is always going to be doing is looking at what's happening. And, you know, there's always something that could be changing technically with the price action because prices are always updating and changing and so on. So what we basically look at is if the price of the stock we're trading hasn't hit target and it hasn't hit our stop loss yet, but the signs are showing that it's starting to look a bit iffy… then our system will actually put out a closed notice as well. Basically saying, look, it's probably not going to hit target, let's not stay in it because we're probably better off getting out now before it then goes on to hit the stop loss.
Nick O’Connor: But you're not guessing when it comes to that?
Adrian Buthee: No, no, no, no. It's not like I wake up in the morning and then suddenly think, oh, I'm not so sure about this Nvidia trade anymore. Let's close that now just because I'm feeling a bit sort of, you know, anxious or whatever, the system takes care of all of that. It will literally flag the exit and another alert will go out by email and through the app to notify when those dynamic exits are identified.
Nick O’Connor: So, you really are never in the dark. And one of the additional benefits of trading US markets is that they don't open until 2.30pm. That means that if you get a trade alert, you know, on a Thursday evening, saying, okay, it's time to buy Apple at $100 – just to get the same example.
You actually have all of the next morning to think about that and you have until 2.30pm that afternoon to place that trade. You’re not having to wake up and, you know, place a trade while you're trying to eat your cornflakes, to use a cliché.
Adrian Buthee: The thing a lot of people think about when trading signals, is it's a bit like you get a notification come through and it's like, oh my God, right, drop everything. And you’ve suddenly got to start placing the trade. Because if you don't do it straight away, because timing is so important, then you're going to miss the trade.
This is not like that. We have time. We purposefully send the signal out after the close of the stock market because there's plenty of time for us to then digest the information, decide if we want to place that trade, and then we can look to place it on the open or around the open the following trading day.
Nick O’Connor: That’s a big advantage because it means of course that you're never guessing and never in the dark. You always know exactly where you stand with a system like this.
Now, before we get to all that, though, let's just recap what the system aims to do for you. It's designed to get you into short term microtrends as they appear in the markets and walk away 7 to 10 days later with a profit.
Forecasts are not a reliable indicator of future results.
It's designed to help you turn the small, regular moves the markets make all the time into a substantial long-term profit. And to give you a shot at trading stocks with confidence without using leverage, CFDs or any complex instruments, and of course it's there to do all of the hard work for you showing you exactly when to get into a trade and precisely when to sell and redeploy that capital into the next trade.
Now, just remember those back tested results you saw earlier. This system generated an 89% profit to the end of August of this year, and that's in the middle of a terrible bear market. Now last year, it delivered 389% cumulative profit. And in 2020, that figure was 334%. All told, since 2011, it's generated 2,459% cumulative profit. Remember, none of this relies on a share doing much more than moving between 5 and 8%.
Figures refer to simulated past performance and past performance is not a reliable indicator of future performance.
You don't need to see big moves of 50%, 100%, 500% to make a lot of money trading. Moves like that don't happen very often anyway. And though we'd all to get in on the next big winner and watch our money double or triple, most of us will probably only see gains like that once or twice in our whole lives.
They’re outlier returns. So why build your entire strategy around them? You're putting your faith in something that's really, really unlikely. Why? This is your nest egg, your retirement account, your trading portfolio we're talking about. So why rely on outlier events to move your money forward? As you've seen today, we've flipped all of that completely on its head. So how exactly can you start using this system today?
Well, we want to make it super easy for you to do. So we're launching a new advisory dedicated entirely to helping you trade the system. Now, all the heavy lifting has been done for you. When the system finds a new trade, you'll get a buy signal delivered via email and the Southbank Investment Research App. So you can pick these trades up on the move if you want.
That alert will contain the stock ticker, buy price, risks involved and the stop loss. You place the trade, and if all goes to plan, you close the trade when the market hits its target or hits its stop loss. If anything, big changes in the meantime, you'll get another alert when it's time to sell. You'll often get five trades a week with each trade being open for around 7 to 10 days.
So on average you're looking at a daily profit opportunity here. Of course, you can trade some, none or all of the opportunities that the system finds. This really is the full package trading system. There's absolutely nothing left to chance. You get everything you need to trade these microtrends now.
To get these alerts and all of the trades that the system spits out, all you need to do is sign up for a brand new trading advisory called the Daily Profit Alert. That will give you instant access to all future trades, alerts and a whole load of extra bonuses. So, for instance, you'll also receive a report Adrian has put together called the Daily Profit Alert Starters’ Guide, which goes into far more detail on this strategy and lays out the backtesting that we've done in more detail for you.
You'll also get instant access to a webinar that Adrian has recorded for you, designed to answer any questions you might have and help start using these trading alerts right away.
And then, of course, you'll start getting trading alerts delivered to you via email. These alerts will contain everything you need to know to place each trade. The risks, target price, stop loss… It's all there for you in black and white.
And remember this really is the result of hundreds of hours of work. We're talking data mining, data crunching. If it was easy, everybody would be doing it. But of course, it's not easy in the slightest. One US based firm, try to add up all the man hours and cost involved in building a system like this.
And it's absolutely extraordinary. They estimate that a system takes roughly a thousand man hours of development time, and that's one man working full time for about half a year. For reference, the cost is big, too, coming in at between $38,000 and $55,000. And all of that is assuming you can find somebody to do all that work for you in the first place.
The good news is all of that work has already been done for you here. So there's no number crunching required and this really doesn't cost anything like $50,000 to sign up to. In fact, as one of the very first people to give this a go, you'll be able to lock in an incredible discount today. So what does a system like this cost?
Well, if this were offered as a black box system from a hedge fund, then you'd pay a 2% fee on the capital that you invested and you'd hand over 20% of your profits. Now, think back to that compounded return our backtesting generated. It turned a £10,000 into more than £575,000 in 11 years. Now, on that basis, you’d hand over more than £100,000 in fees to the fund.
And frankly, you'd probably be happy to do so. But just to pour water over that idea, you'd probably never even get in the door of a hedge fund with £10,000 to invest. According to a Forbes article I saw, you need a minimum of £80,000 for a hedge fund to accept you as a client. In other words, you either need months of time to develop your own system, which would cost a fortune both in time and actual money, or you'd need a vast pot of cash to get in with a sophisticated hedge fund that have built their own trading system.
But today, there is another way because a one-year subscription to the Daily Profit Alert will cost just £1,999 a year. Now that fee is fully refundable for the next 30 days. So, you have total peace of mind to give this a go, see how it works, paper trade and then make up your own mind.
Just remember that compounded total return we shared. A £10,000 account could have become £575,000, risking just 0.5% per trade before costs and taxes.
Figures refer to simulated past performance and past performance is not a reliable indicator of future performance.
I don't know of any other way of generating a return like that without needing huge winners of 100% or more or without using leverage or CFD. This really is a first of its kind for Southbank Investment Research. And today you have the chance to be one of the first wave of people on the planet to give it a go.
To celebrate the launch, we’re giving you the chance to lock in a deeply discounted subscription… saving £700…
Bringing the cost down to just £1,299.
Even better, you can LOCK that discounted rate in for good. So you’ll save another £700 against the full price with every year you subscribe.
But here’s the thing…
Sign up by midnight on Wednesday – that’s 26th October – and not only will you guarantee yourself access to this exclusive new service…
And save £700 on your subscription…
You’ll ALSO get a free second year of Daily Profit Alert added to your subscription.
So, you effectively get two years for a lot less than the price of one.
But only if you move before midnight on Wednesday 26th October.
I must warn you – we are only offering 100 places at this price, and they could be snapped up very quickly. Perhaps within hours.
But if you want to get in on this deal, you need to let us know before midnight on Wednesday.
After that, this offer will come off the table. I’ve no idea when it’ll be repeated.
And, as I said, there are only 100 places and they could be gone much sooner than Wednesday night.
Let's do a quick recap for everyone at home, Adrian. So, you know, this is a completely new system's never been shared with the public before.
It's taken months. Or if you want to go really, really big picture in terms of the people that are building, years’ worth of testing that has gone into it and turns those small micro moves that we've been talking about into potentially big profit, importantly with no leverage. But let's just say, for instance, somebody at home is interested in this, but they're a little bit on the fence still.
They don't quite know whether or not this is right for them. You know, what would you say to that person?
Adrian Buthee: I can understand that. But I just want you to think – you're not going to be alone. Yes, we get the signals and yes, we provide those out to any you know, any subscriber. What we also do is we do these weekly videos and this is where you're going to get a chance to listen and hear from our expert traders and myself to Stuart Hopkins, Keith Hepburn. They're on our team. And we'll be doing weekly videos going through exactly what's going on with the market.
So, you get a good understanding of what's happening, not just a signal, but you’ll also get the broader context of what's happening with the markets… about the open positions… what perhaps to be thinking about or looking out for over the week ahead. Just to make sure that you always have that confidence alongside this journey.
Nick O’Connor: So, it's not a case of just getting alerts from a system and trading them with no sort of human contact, no human element. I know that's something people do struggle with. It doesn't matter how well tested something is, how rigorous, how powerful a system can be. It's always nice to hear from the people that are associated with that system too, just to provide that bit of context, a bit of extra handholding to speak.
Adrian Buthee: Definitely, because, you know, we're going to be alongside the journey with everybody. We’ll be looking at the same trades. So, you know, it's really important that you get that context from expert traders and investors who will be able to share that knowledge and help us educate all the subscribers to be better investors as well.
Nick O’Connor: So just quickly recap what everybody gets. They get the trading alerts. And that's the heart and soul of the strategy. That's where you got the specific ticker symbol to trade, profit, target, stop loss, everything that's all delivered via trading alert. You also get the Starters’ Guide Report, which kind of puts the meat on the bones of the strategy and talks people through the risks associated with this.
The welcome video that you've put together for everybody just to get people on board and understanding how this works. And then the regular ongoing video updates from you and the team. So you really do get a nice mix of the specific trading advice that is the heart of this strategy with the broader analysis and the and the contact points with you, which I think is great.
But of course, beyond what you get… the mechanics of what you get as part of the Daily Profit Alert… really what we're talking about here is you getting an edge, aren’t you. And I think this year has really proven that people at home are going to need an edge now more than ever, because it's been an absolute nightmare in terms of stocks, bonds, even gold, cryptos. It's all been, you know, really under the pump.
There might have been bright spots here and there, but an edge like this in a market like this could really be priceless in in the months and years to come, couldn't it?
Adrian Buthee: Yeah, absolutely. I think there's been a lot of investors who have lost a lot of money this year. And I think, you know, now more than ever, I think we need traders need some help, some support to help guide them on that journey. And that's what we're really looking to provide here with a rigorously tested system and the support with those videos as well to give any trader from home and investor from home the support, the guidance that they're going to need.
At the end of the day, we know we've got what have we got here? We've got inflation, we've got interest rates we've got going on. We've got the threats of recession. Everything's really happening. And, you know, for a lot of traders, it can be quite difficult to digest all that information, but also to then use it rationally. Again, that's why an edge is, and that's why having a systematic approach to trading is going to be so beneficial over the and years ahead, really.
Nick O’Connor: And that is really why we've been here today, to give everybody the chance to get that edge in their trading. So as we wrap up today's show, I hope you’ve found this useful, informative, educational. And I hope that you're as excited as we are to give this system a go. So we've laid it all out for you in black and white.
- You’ll save £700. Not just on your first year but for every year you stay with us.
- You’ll have 30 days covered by our money-back guarantee, to see if its for you
- If you act quickly, you’ll get an EXTRA year’s subscription on the house – but you MUST be one of the first 100 people to grab the offer
If you click on that link above, you'll be taken to a secure order form where again, everything is laid out for you. Everything that you get as part of this offer. So that's the discount on offer… the deadline involved… everything that you'll get as part of your subscription to the Daily Profit Alert as well as a little bit more detail on the strategy itself.
Now just remember some of the stuff that we've talked to you about today…
Figures refer to simulated past performance and past performance is not a reliable indicator of future performance.
You know, an 89% profit in this year. While most markets have had one of their worst years in memory by many metrics, you know, that is incredible result alone. But on top that, you have that incredible cumulative profit result since 2011. And the results that we showed you, when you are compounding to that as well were really quite exciting.
So this is a first of its kind system. It's never been shared with the public before and we've never shared it with our readers before. So you really are in a privileged position to give this a shot, make a big saving and get this working for you. The only thing left for you to do is to hit that link:
Remember the deadline and remember that you'll make a big saving if you join before that deadline. It is worth your while to give this your full time and attention before this offer comes off the table. So, hit that link below right now. Fill in your details on the secure order form and our team will take care of the rest.
Adrian, it's been a pleasure talking to you about your system and the work that you've been doing. I mean, you can tell just by talking to you that it's the result, not just of thousands of man hours, but lots of care and attention goes into this sort of stuff. It really is the life's work of a lot of the traders over at TrendSignal.
So thank you very much for joining us and talking to us about it. Like I said, I hope everybody has got something out of this broadcast. The link you need is directly below right now. Thank you very much. And goodbye.